Project Summary & Skills Used
For our Computing II final project, my teammate Connor Gage and I built an interactive NBA analytics web application that uses machine learning to make two types of predictions:
Shot Predictor — Given the conditions of a shot (shot clock, dribbles, touch time, shot distance, and defender distance), a Random Forest model predicts whether the shot will be made or missed.
Rebound Heatmap — Users place all 10 players on a basketball court, and the model predicts whether the rebound will be offensive or defensive. It also generates a color-coded heatmap showing offensive rebound probability across different court zones.
Skills & Technologies
- Java with object-oriented design across multiple classes
- Vaadin framework for building a full web UI entirely in Java
- SMILE (Statistical Machine Intelligence and Learning Engine) library for training Random Forest classifiers
- Tablesaw for reading, joining, filtering, and pivoting CSV datasets
- File I/O for loading real NBA shot log and play-by-play data from CSV files
- GitHub for version control and team collaboration
Project Development Process
Our original goal was to build something that combined our interest in basketball with the machine learning and Java skills we had been developing in class. We started with the shot predictor concept. The idea of feeding in shot conditions and getting a made/missed prediction felt like a good use for a Random Forest model.
Once we had that working, we expanded to include the rebound predictor and heatmap. This was significantly more complex because it required spatial data: we needed to track the x/y positions of all 10 players on the court and feed those 20 coordinates into the model. The interactive court where users click to place players was one of the bigger challenges. Getting the coordinate mapping right between pixel positions and real court dimensions (94 × 50 feet) took a lot of time.
One roadblock we hit was getting the heatmap overlay to align correctly with the court image. The court rendering area didn’t start at pixel (0,0), so we had to manually define offsets and map zones to the correct half of the court depending on where the shooter was placed. We also had to make sure the model input ordering matched exactly between training and prediction. The coordinate array follows a specific order (d1 through d5, then shooter, then t1 through t4) and any mismatch would break predictions.
The final product matched our expectations well.
Key Features & Highlights
Shot Predictor
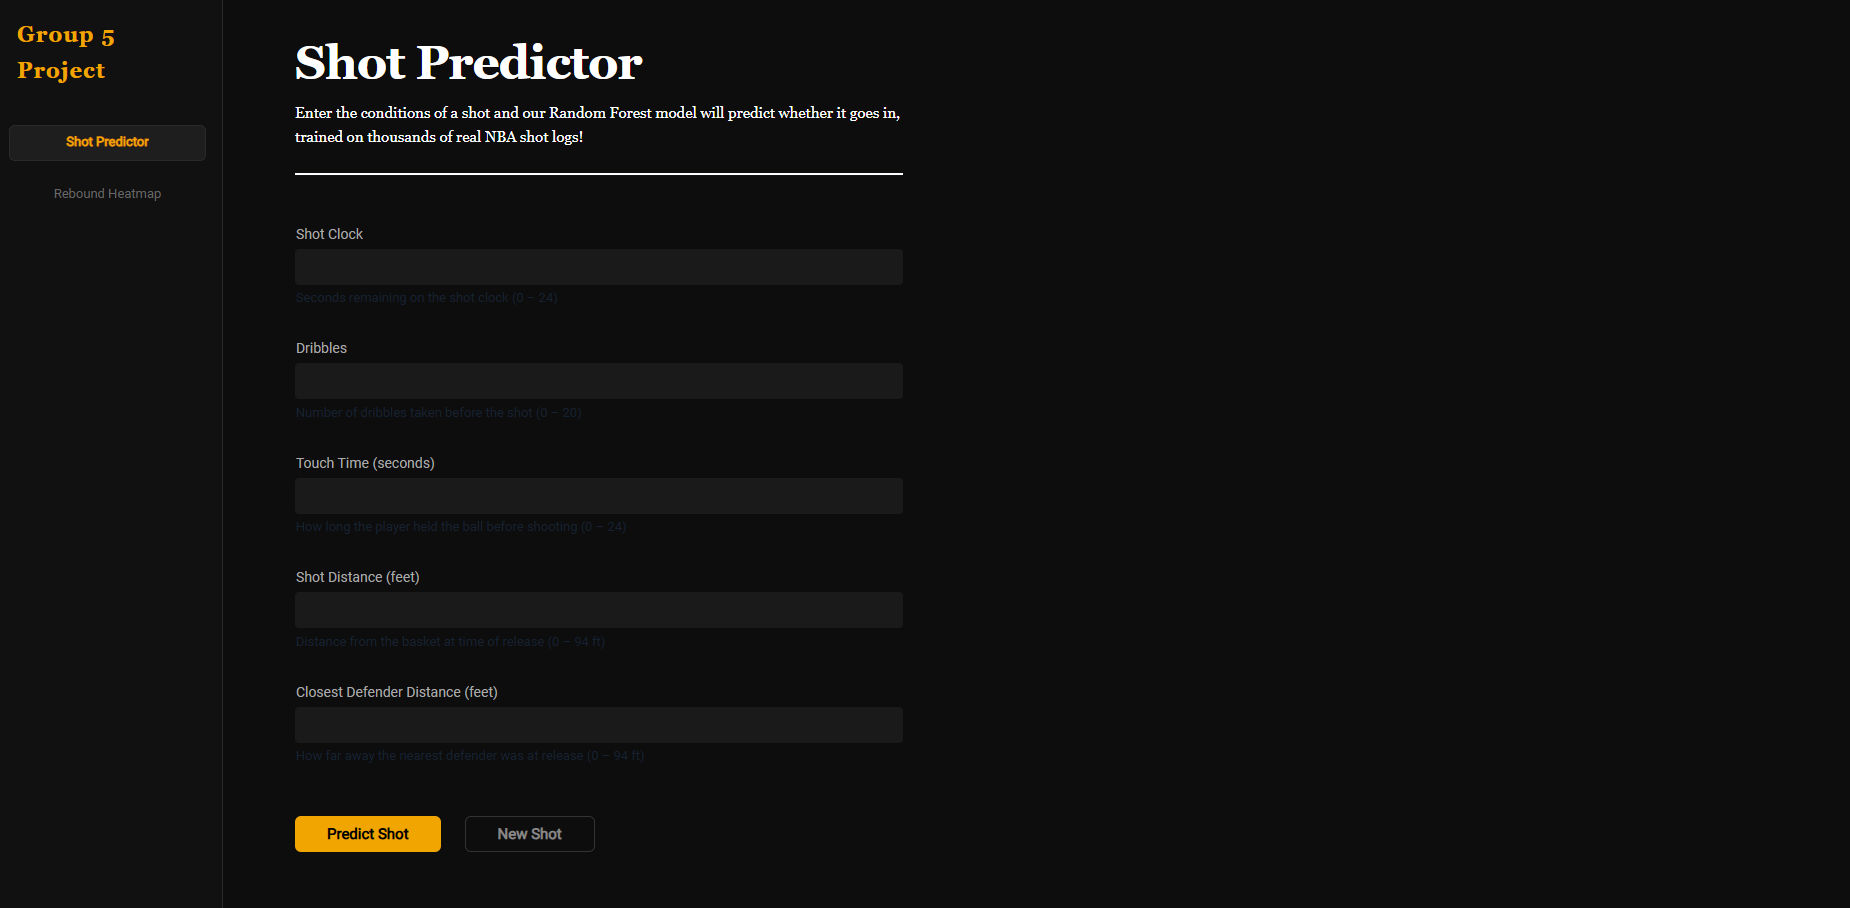
The Shot Predictor page lets users enter five input features — shot clock, dribbles, touch time, shot distance, and closest defender distance — and get an instant prediction. The model was trained on thousands of real NBA shot logs using a Random Forest classifier. The UI provides clear feedback with a green “SHOT MADE” or red “SHOT MISSED” result box.
The prediction logic lives in ShotPredictor.java, which reads the CSV data at startup, cleans missing values, extracts the relevant columns, and trains the model. At prediction time, it builds a single-row Tablesaw table from the user inputs and runs it through the trained Random Forest.
Rebound Heatmap
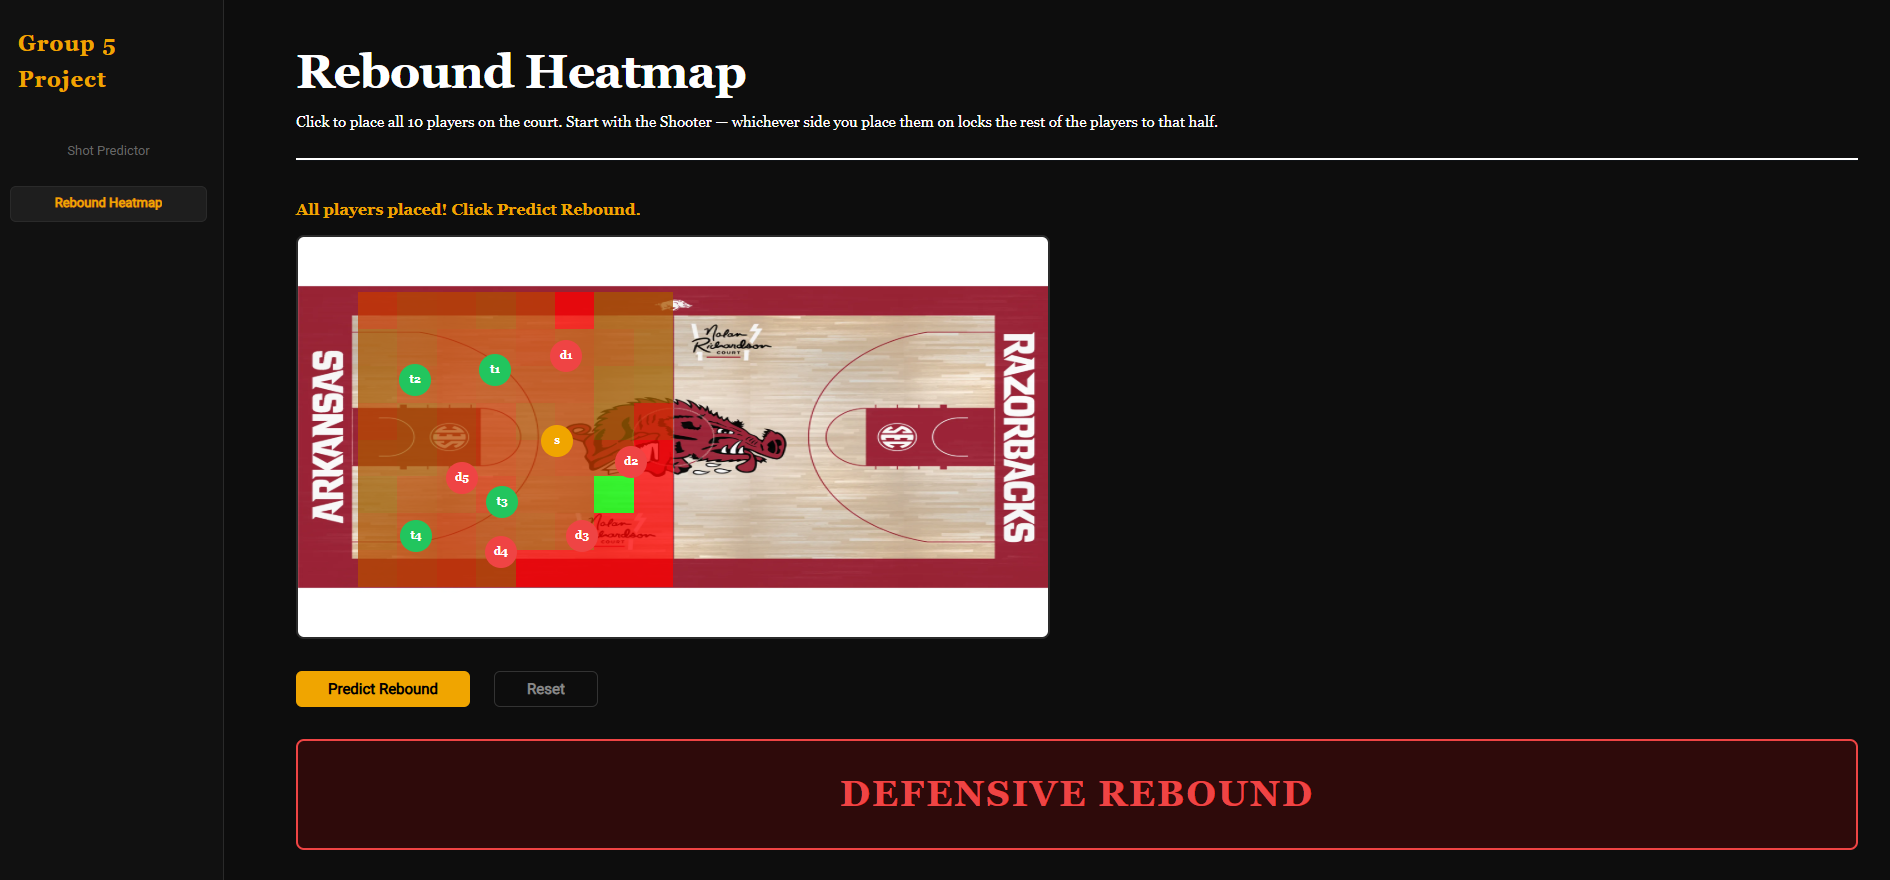
The Rebound Heatmap is the more interactive feature. Users click directly on a basketball court image to place all 10 players. The shooter first (which locks all subsequent placements to that half of the court), then four teammates and five defenders. Each player appears as a colored circle (orange for shooter, green for teammates, red for defenders).
After placing all players, the model predicts offensive vs. defensive rebound and overlays a heatmap on the court. The heatmap divides the half-court into an 8×8 grid and colors each zone from red (low offensive rebound probability) to green (high probability), calculated from the actual data. This gives users a visual sense of where offensive rebounds are most likely to occur.
Code Architecture
The project is organized into three main classes:
MainLayout.java— The Vaadin UI with sidebar navigation, two pages, input fields, click-to-place court interaction, and heatmap renderingShotPredictor.java— Loads shot log CSV data, trains a Random Forest, and exposes apredict()methodReboundPredictor.java— Joins play-by-play and location CSVs, pivots player positions into a flat feature row, trains a Random Forest, and provides both single-prediction and heatmap methods
Reflection
I’m proud of how the interactive court placement turned out. Translating pixel clicks into real court coordinates, enforcing the half-court constraint, and rendering player markers in real time made the app feel polished and intuitive. The heatmap was also satisfying to build. Seeing the color-coded zones light up after placing players made the predictions feel real rather than just a number.
I grew a lot as a problem-solver through this project, especially in debugging coordinate mapping issues where the bug wasn’t a crash but just wrong positions on screen. I also got more comfortable with reading library documentation (Vaadin, SMILE, Tablesaw) and adapting examples to fit our specific use case, which is a skill that carries beyond any single project.